A gap in a home energy monitor’s chart means that the selected view is not showing a value for that interval. It does not, by itself, mean your home used no electricity, lost power, or has a faulty monitor. First identify the device, channel, date range, and chart resolution. Then check the model’s rules for offline recording and historical data. Keep missing readings separate from measured zeroes until you have an explanation.
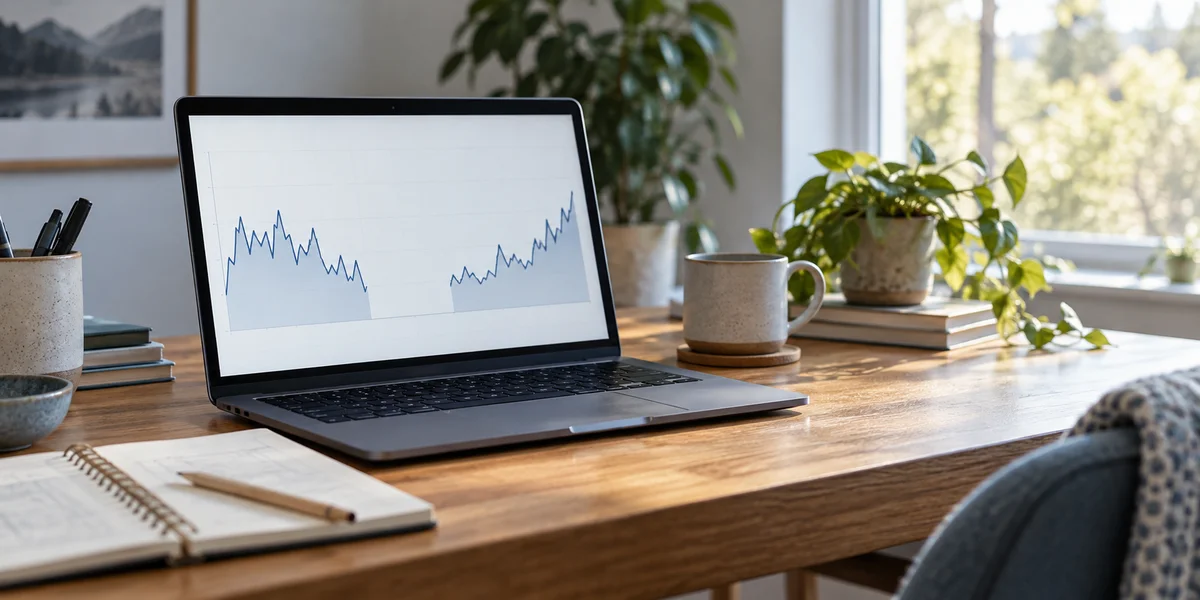
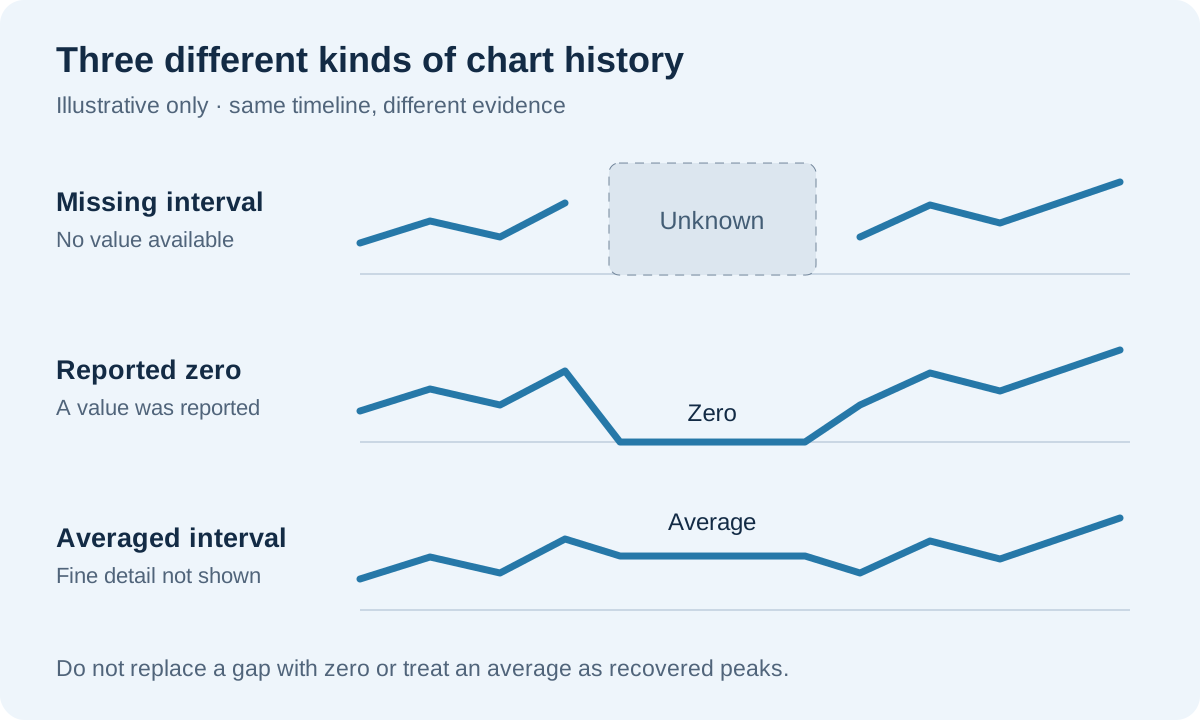
The header is an illustrative home scene, not a Grus app screenshot. The diagram below uses invented values to explain missing data, not measurements from a customer or product.
Missing, zero, and averaged readings are different
Imagine an hourly export with three rows: 0.6 kWh at 10:00, a blank at 11:00, and 0.8 kWh at 12:00. You can add the two known values and report 1.4 kWh of recorded energy. You cannot call that the complete three-hour total. Replacing the blank with zero would silently turn an unknown into a measurement.
A chart that joins points across a gap can also be misleading. A straight line between two observations is not evidence that the intervening load followed that line. Similarly, a filled-in average might preserve an estimated total without preserving the timing of individual events.
| What the view shows | What you can say | What you cannot conclude from it alone |
|---|---|---|
| Blank interval or missing row | No value is available in this view for that interval. | The home used zero energy. |
| A reported zero | The system reports zero for the selected quantity and interval. | Every appliance was off, or the reading was independently verified. |
| An averaged interval | Detail has been summarized into an interval value. | A particular appliance ran at a particular minute. |
| A recent last-update time | Some data has arrived recently. | All older missing intervals have been recovered. |
Keep the units visible too. A live kW reading and an hourly kWh total answer different questions. For an introduction to those views, see how to read home energy monitor data.
Start with the exact view, not the hardware
Before changing anything, take one screenshot that includes the chart labels. Write down the selected device and channel, displayed units, start and end times, and the time you took the screenshot. If the interface offers different resolutions, inspect the same period at the next broader resolution without changing the device configuration.
This separates two useful questions: “Is the period absent from every available view?” and “Is only its fine detail unavailable?” Record the answer rather than assuming the broader total explains the gap.
Check the date and time zone when comparing screenshots or exports. A late-night interval can fall on different calendar days in different time zones. Emporia’s export guidance explicitly calls for matching time zones and billing-period boundaries. The same comparison discipline is useful when organizing a support request: include the actual time zone, not just “yesterday afternoon.”
For example, a screenshot labeled “Today” taken before midnight and another taken after midnight do not necessarily cover the same period. Save the dates as well as the pictures. This small detail can prevent a long investigation of two different windows.
A network interruption does not have one universal outcome
Offline behavior is a product-specific fact. Some systems retain measurements for later upload; the amount of retained detail and the recovery behavior depend on the device. Do not assume that reconnecting recreates every missing point.
As one documented example, Emporia describes Vue interruptions shorter than roughly 15 minutes as buffered, while longer interruptions are represented using averaged data. Its guidance also warns that extended-offline readings do not carry the same accuracy guarantees as live reporting. That is an example of Vue behavior, not a specification for Grus or another monitor.
Your useful evidence is the timeline: when the gap started, whether the app reported an offline state, whether other internet services were affected, and when fresh readings returned. A router outage that overlaps the gap is a clue to share, not a complete diagnosis.
Do not open an electrical panel, move a sensor, cycle circuits, or factory-reset equipment to investigate a chart. Those actions are outside this data-reading guide. Preserve the existing history and follow model-specific support guidance if a physical or configuration issue is suspected.
Older fine detail may have expired
An old chart is not necessarily a permanent archive of its original resolution. Emporia’s storage documentation, for example, lists different retention periods for second, minute, and aggregated data. It also says overwritten minute-level history cannot be recovered from local storage. These are that manufacturer’s rules, not a universal retention policy.
For your monitor, look for three separate statements in its documentation: which resolutions exist, how long each is retained, and whether export is supported. If you need detailed history for a specific investigation, save a supported export while it is available. Keep the original file unchanged and make a separate copy for calculations.
Do not delete history in an attempt to refresh it. A missing-data investigation should preserve evidence, not remove the records that support may need.
How to compare periods without hiding the gap
Suppose you are comparing Monday and Tuesday after changing a household routine. Monday has a complete day of readings; Tuesday has a two-hour gap. A lower recorded total on Tuesday does not establish a reduction in consumption. The comparison is incomplete before you even consider weather, occupancy, or different appliance use.
Use an explicit note such as: “Tuesday has two missing hourly intervals; whole-day comparison withheld.” If you compare only the overlapping complete periods, label their exact hours and do not extrapolate them to the full day. This is a proposed reporting practice, not a monitor feature.
For time-of-use analysis, timing matters as well as totals. An average across several hours cannot tell you which minutes belonged to a particular price window unless the source preserves that information. Keep those intervals out of a precise peak-versus-off-peak claim. Our time-of-use energy monitoring guide explains the separate question of matching usage with rate periods.
Send support a small, useful evidence packet
A focused request is easier to investigate than “the chart is wrong.” Include:
- The product model and app version, if visible.
- The affected chart, channel, units, and resolution.
- The first and last missing timestamps, with time zone.
- A screenshot and the unchanged export, if your model supports one.
- Whether live readings have resumed and whether the historical gap remains.
- Any known network interruption at the same time, clearly labeled as an observation.
Remove personal account details from screenshots. Never send passwords or Wi-Fi credentials. A useful question is: “For this model, should this interval be recoverable, summarized, or unavailable?” That is more precise than asking support to infer what a blank line means.
Questions homeowners often ask
Does a gap prove there was a power outage?
No. A missing chart interval alone cannot identify the cause. Keep any independently known outage information separate from what the monitor actually displayed.
Can I fill blanks with the previous reading?
Only as a clearly labeled estimate in your own analysis, never as recovered data. For comparing household changes or investigating peaks, retaining the gap is usually the more transparent choice.
Will reconnecting restore the history?
That depends on the model’s buffering, retention, and recovery rules. A return of live readings is evidence of current reporting, not proof that older detail was restored.
What should I ask Grus?
If the affected device is a Grus product, contact Grus Support with the model, timestamps, and screenshot. Ask for the documented behavior of that exact device before treating missing intervals as zero, recovered measurements, or evidence of energy savings.