
The best goal for your first week with a home energy monitor is not to identify every appliance or prove immediate savings. It is to learn what the dashboard measures, establish one complete-day baseline, add context from routines you actually know happened, and compare similar days before drawing conclusions.
Use the seven days to create better questions. Confirm the dashboard clock and visible measurement scope. Record ordinary household events without guessing which device caused every change. Compare full weekdays with full weekdays and weekends with weekends. At the end of the week, keep a short list of repeated patterns, unknowns, and questions for product support, your utility, or a qualified electrical professional.
This guide follows a hypothetical household—the Morgan family. It does not represent a real customer result, an expected reading, or a promise that monitoring will lower a bill.
What the first week should accomplish
The first week is an orientation period. A useful outcome is a small, trustworthy observation record—not a complete diagnosis of the home.
The U.S. Energy Information Administration explains that watts and kilowatts measure power at a moment, while watt-hours and kilowatt-hours measure energy used over time. Its guide to measuring electricity is the reason this plan separates momentary readings from complete-day totals.
By the end of seven days, the Morgan family wants to answer five grounded questions:
- What date, time zone, and time window does each dashboard view represent?
- What physical measurement scope is visible in the configured system?
- What does a normal complete weekday or weekend look like in this home?
- Which repeated changes line up with routines the family already knows occurred?
- Which observations remain unknown and need another source or a qualified person?
That is enough for a productive first week. Exact bill matching, appliance diagnosis, installation assessment, and savings claims are separate questions with separate evidence.
Before Day 1: confirm the visible boundaries
Start with information already available in the app, product documentation, installation handoff, and utility account. This article does not require opening an electrical panel, moving a current transformer, changing wiring, or performing an energized test.
The Morgan family records:
- the dashboard time zone and the app’s definition of a day;
- whether the screen shows real-time power, interval energy, daily energy, or a longer trend;
- the measurement scope documented for the configured system;
- whether any labels were manually assigned and who verified them;
- dates when connectivity, configuration, or household occupancy was unusual;
- the utility billing period, if the family later plans a bill comparison.
If the measurement scope is unclear, write “scope unknown” and ask the installer or product support. A chart shape alone cannot establish scope, and answering that question does not require opening the electrical panel.
A simple seven-day observation plan
Each day has one job. The sequence prevents a single spike or partial day from becoming a story the data cannot support.
| Day | Main task | Record | Do not conclude yet |
|---|---|---|---|
| 1 | Establish a complete-day baseline | Start/end time, complete daily kWh, occupancy, unusual events | Which appliance caused each change |
| 2 | Note a few known routines | Approximate time of cooking, laundry, charging, cooling, or another known event | That one routine explains the whole-home pattern |
| 3 | Recheck the time window | Whether bars represent intervals and whether the day is complete | That a partial-day total is low or efficient |
| 4 | Compare a similar day | Same day type, similar occupancy, same dashboard boundary | That any difference proves a fault or savings |
| 5 | Look for repeated timing | Patterns that recur at roughly the same time | Automatic appliance identification |
| 6 | Review quiet periods | Overnight or away-period baseline within the measured scope | Which standby device is responsible |
| 7 | Create a question list | Repeated patterns, exceptions, unknowns, and next owner | That one week predicts every season or bill |
The table is deliberately conservative. “Keep observing” is a valid outcome when days are not comparable or context is missing.
Day 1: establish one complete-day baseline
On the first day, the Morgan family resists the temptation to chase every real-time change. It first checks when the dashboard day starts and ends. After the day closes, it records the complete daily total and a few broad facts: weekday or weekend, normal or unusual occupancy, major weather-related schedule changes, and any known outage or connectivity gap.
A complete day is more useful than a partial total because the comparison boundary is clear. Noon today is not comparable with all of yesterday. A momentary kilowatt reading is also not interchangeable with a daily kilowatt-hour total. If those units are unfamiliar, use the companion guide on how to read home energy monitor data before interpreting the chart.
Day 1 is a reference point, not “normal” forever. One day can be affected by weather, guests, work schedules, maintenance, or an unusual household routine.
Days 2 and 3: add only known household context
For the next two days, the Morgan family adds a few timestamped notes about events it knows occurred. It may record when dinner preparation began, when laundry ran, when a vehicle was plugged in, or when the cooling schedule changed. The note describes the event; it does not claim the monitor identified a device.
Whole-home changes can contain overlapping loads. Even a correctly labeled circuit may include more than one device. A pattern that appears after a routine begins is a clue to compare, not proof of cause.
The family uses a short note format:
Tuesday, evening: dinner preparation and laundry overlapped. Dashboard use rose during the same general period. Cause not isolated.
That wording preserves what is known and what is not. It is more useful than writing “the dryer caused the spike” when the measured scope and overlapping activity do not prove it.
Days 4 and 5: compare like days
By the middle of the week, the family can compare two complete days. The strongest comparison uses the same dashboard boundary and similar context: weekday with weekday, occupied day with occupied day, or weekend with weekend.
The family asks:
- Did total kWh move in the same direction as a known change in routine?
- Did a pattern repeat at a similar time on more than one comparable day?
- Was one day incomplete, affected by an outage, or otherwise unsuitable?
- Did the app clock, interval boundary, or visible scope change?
- Is the difference large enough to keep observing, without pretending to know the cause?
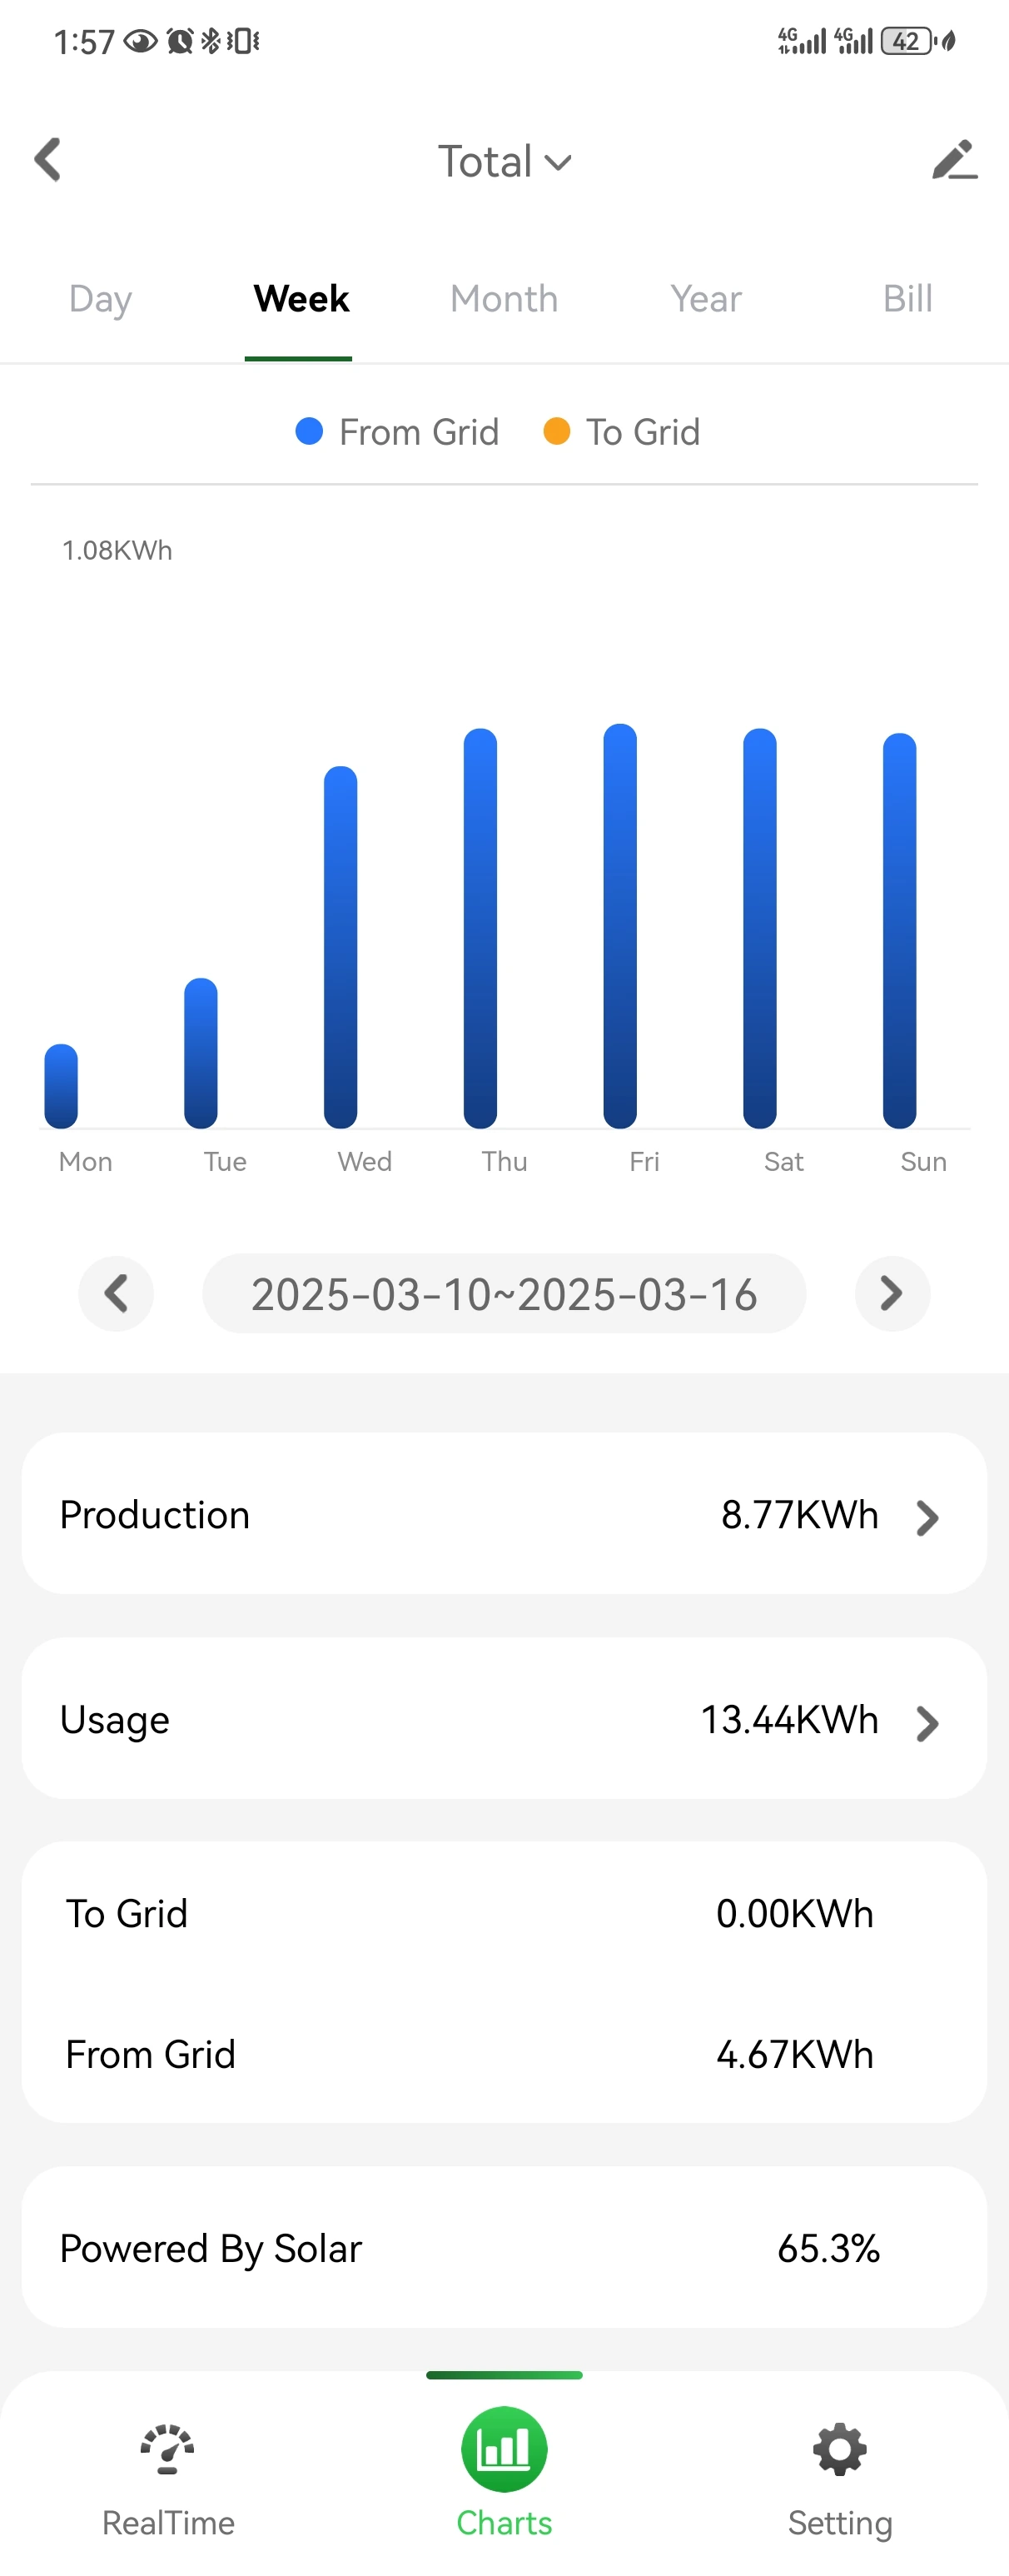
The week chart below is useful because it puts complete days next to one another. The values shown belong to the approved product visual; they are not the Morgan household’s data and are not a benchmark for another home.
The Department of Energy describes a home energy assessment as a broader evaluation of how a home consumes energy and which improvements may be appropriate. Its energy-efficiency overview helps define an important boundary: a monitor can support observation, but a dashboard review is not a professional building assessment.
Day 6: review quiet periods without naming a culprit
Day 6 focuses on a period when household activity is relatively low, such as overnight or a known away period. The Morgan family compares that period across more than one similar day and notes whether the measured load looks steady, variable, or interrupted.
A quiet-period baseline can lead to useful questions:
- Is the visible load consistently present across comparable nights?
- Does it change when occupancy or a known schedule changes?
- Is the dashboard showing a complete interval or a connectivity gap?
- Does the configured measurement scope include everything the family assumes it includes?
It cannot automatically name the responsible devices. Refrigeration, HVAC, water heating, networking, chargers, pumps, standby electronics, and other loads may overlap. The right result may be “persistent measured use during a quiet period; cause unknown.”
Do not unplug safety-critical equipment or change equipment settings merely to force a lower chart. Follow manufacturer instructions and household safety needs.
Day 7: turn observations into owned questions
On the seventh day, the Morgan family summarizes rather than experiments. It keeps only repeated or clearly documented observations and assigns each question to the source that can answer it.
| Question | Best owner or evidence source |
|---|---|
| What period and rate determined the bill? | Current utility tariff and statement |
| What does this screen measure and how are intervals defined? | Product documentation or product support |
| Does the configured system cover the assumed circuits or service scope? | Installation record and qualified electrical professional |
| Why did one known routine overlap a measured increase? | More comparable observations; verified circuit context if available |
| Is a persistent unusual reading an electrical or equipment problem? | Qualified electrical or equipment professional |
| Did a routine change reduce billed cost? | A later utility bill under the same applicable tariff |
This ownership map prevents the app from being treated as the answer to every energy, billing, or electrical question.
Use a first-week decision flow
The flow below keeps the week focused on observation, comparison, and safe escalation.

Notice that the flow does not require a “problem found” result. A trustworthy baseline and a better-defined unknown are both useful outcomes.
What not to do during the first week
Avoid these common shortcuts:
- Do not compare incomplete and complete days. A partial total can create a false difference.
- Do not name an appliance from one whole-home spike. Correlation is not identification.
- Do not expect the monitor to reproduce the bill. The utility owns its meter, tariff, billing period, fees, credits, and adjustments.
- Do not treat a consumer dashboard as a diagnostic instrument. Persistent unusual readings need the appropriate qualified owner.
- Do not open the panel or move sensors to investigate a chart. Installation and service belong to qualified electrical personnel.
- Do not promise savings after seven days. A pattern can support a decision; only later evidence can show an actual result.
- Do not make the home uncomfortable or unsafe to improve a graph. Household needs and equipment instructions come first.
These limits do not make monitoring less useful. They make the observations more credible.
When to stop observing and ask for help
Contact the appropriate owner when the question moves beyond visible-data interpretation.
Ask product support when the app time boundary, units, missing intervals, account behavior, or documented measurement view is unclear. Ask the utility about tariff enrollment, meter intervals, billing periods, charges, credits, or a statement discrepancy. Ask a qualified electrical professional about panel fit, CT placement, wiring, persistent unusual electrical readings, or any installation concern.
If there is heat, smoke, odor, arcing, repeated breaker operation, loss of power, or another immediate safety concern, stop using the dashboard as a troubleshooting guide and follow the relevant emergency and qualified-professional path. Do not wait for a week of data.
Finish the week with a baseline, not a verdict
After seven days, the Morgan family should have a clear time boundary, at least one complete-day baseline, several notes tied to known routines, one or two like-day comparisons, and a short list of owned questions. That is a strong first-week result.
The monitor’s value is visibility. The utility owns billing facts. Product documentation and support own the dashboard contract. Qualified electrical professionals own panel and installation work. The household owns routine choices made within comfort, safety, and equipment limits.
Review the Grus split-phase energy monitor when you are ready to compare its measurement scope and the fit questions to ask before buying.