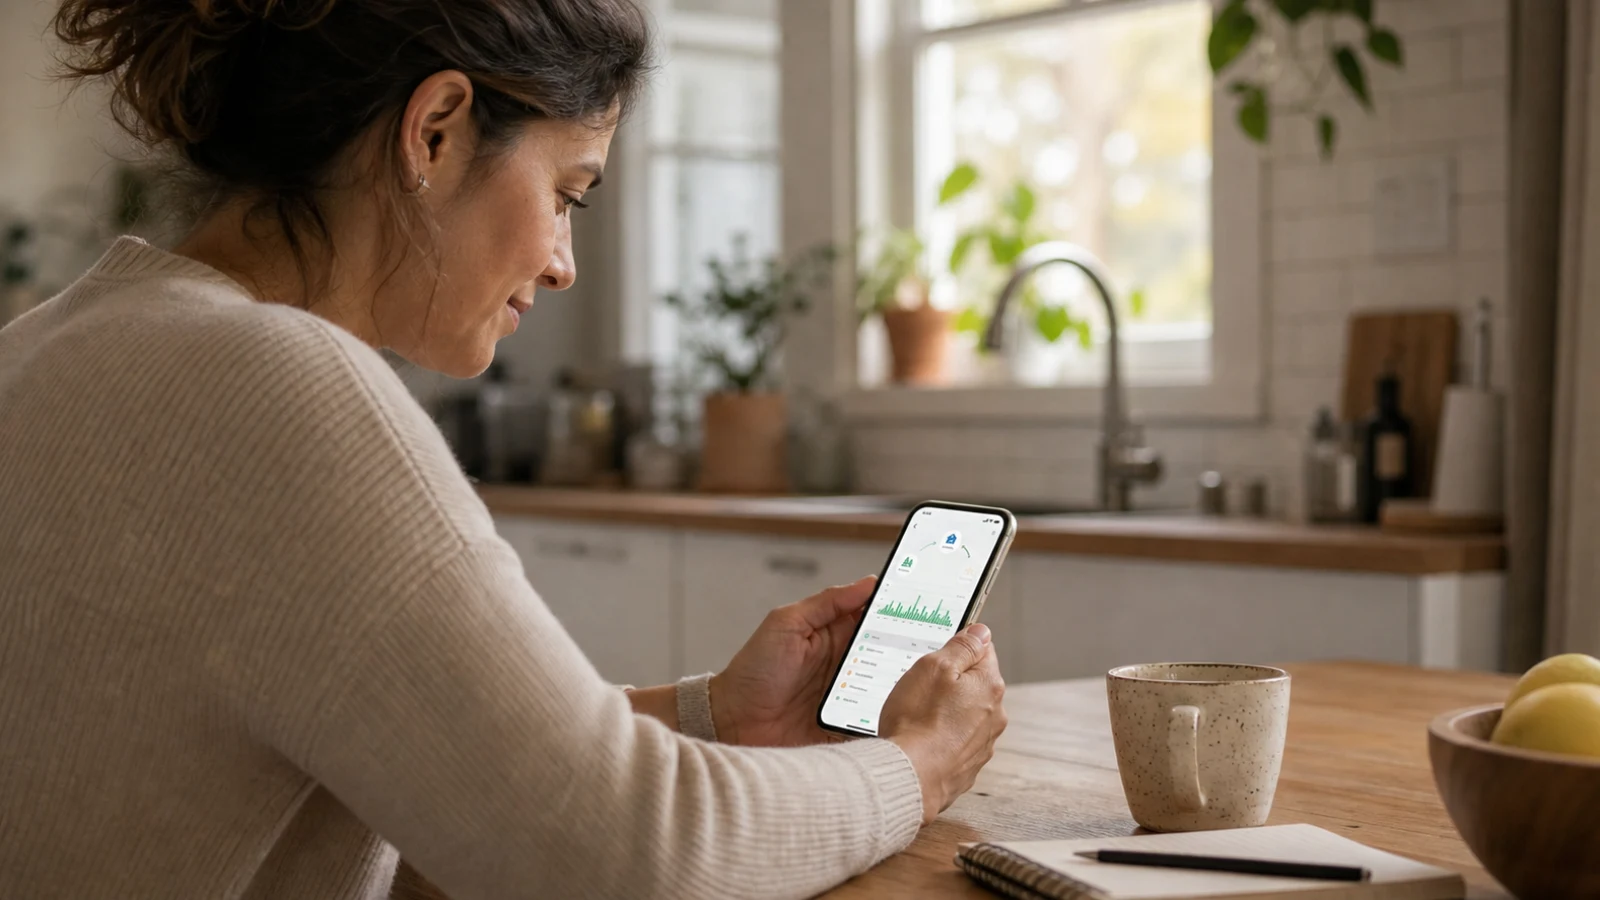
You can track meaningful home energy patterns without measuring every appliance one by one. A whole-home monitor shows how fast the household is using electricity and how that use changes over time. A multi-circuit monitor can narrow the view to selected circuits. Utility interval data and plug-level meters can add context where available.
The important limit is equally simple: whole-home or circuit data does not automatically identify every appliance. It helps you compare patterns and narrow questions. Confirming a specific device usually requires a known circuit, a controlled observation, a plug-level measurement, or qualified professional help.
Choose the level of detail you actually need
Different tools answer different questions. Start with the least detailed view that can support your decision, then narrow the scope only when the data points to a useful follow-up.
| Data source | What it can show | What it cannot prove by itself |
|---|---|---|
| Whole-home monitor | Total real-time load and energy use over time | Which exact appliance caused a change |
| Multi-circuit monitor | Usage for selected, correctly mapped circuits | The identity of every device sharing a circuit |
| Utility interval data | Metered use for the intervals your utility provides | Real-time circuit detail or the cause of a spike |
| Plug-level meter or smart plug | Use by a compatible plug-in device | Use by hardwired equipment or other circuits |

If you are unsure whether a dashboard value represents instantaneous load or accumulated energy, read How to Read Home Energy Monitor Data before comparing periods.
Start with whole-home patterns
A whole-home view is useful when your first question is broad: When does electricity use rise, and does that pattern repeat?
Use the same measurement boundary and compare like with like:
- Note a typical low-load period for your home.
- Compare similar hours on different days.
- Look for changes that repeat at a similar time or under similar household conditions.
- Compare complete daily totals rather than treating one brief peak as the whole story.
Suppose the dashboard rises each weekday around dinner and then falls later in the evening. That is a repeatable household pattern. It is not yet proof that an oven, water heater, HVAC system, or another specific load caused it. More than one load can operate at the same time, and a whole-home total combines them.
This first pass is still valuable. It tells you whether there is a consistent question worth narrowing, instead of asking you to test every device in the home.
Use circuit-level data to narrow the question
Circuit-level monitoring can separate selected loads or groups of loads when the circuits have been correctly mapped. A dedicated EV charging, HVAC, water-heating, or solar circuit may be easier to interpret than a general-purpose circuit that serves several rooms.
Circuit labels should be treated as verified context, not automatic appliance detection. A label may describe what a circuit is intended to serve, but multiple devices can share it and household wiring can change over time. If a label or circuit mapping is uncertain, treat the name as unverified context.
A practical comparison looks like this:
- Confirm which dashboard series represents the whole home and which represents a mapped circuit.
- Compare the circuit and whole-home charts over the same time range.
- Note whether the circuit change explains most, some, or little of the whole-home change.
- Repeat the observation before drawing a conclusion from one event.
This process narrows a broad pattern to a circuit-level question. It does not diagnose the condition of equipment, prove a fault, or establish that one appliance is responsible.
Add utility data for a longer billing view
If your utility provides interval or daily data, use it to compare longer periods and check whether the timing of higher use is consistent with the utility meter record. Utility portals vary: some show hourly or sub-hourly intervals, while others provide only daily or billing-period totals.
Keep the measurement boundaries clear. A home monitor and a utility bill may use different intervals, timestamps, rounding, tariffs, fees, and billing rules. Home-monitor data is useful for understanding patterns, but it should not be described as the utility’s billable total unless that role is explicitly documented.
For a higher-bill question, compare:
- Complete billing periods with a similar number of days.
- Weather and major household schedule changes.
- New equipment or known changes in use.
- The utility’s rate plan and billed energy, rather than estimating cost from one real-time reading.
Use plug-level measurement only where it fits
A compatible plug-level meter or smart plug can answer a narrower question about one plug-in device. It can be useful after whole-home or circuit data points to a specific area, but it is not a universal solution.
Do not use a plug-level device for hardwired equipment, loads outside its documented rating, or equipment whose manufacturer instructions prohibit it. Space heating, HVAC, water heating, EV charging, and other high-load equipment may require a different measurement path and qualified guidance.
The goal is not to create a permanent meter for every appliance. It is to use a narrower measurement only when it can confirm a specific, safe, and useful question.
What automatic appliance identification would require
Some energy products describe appliance recognition or disaggregation features. Those capabilities depend on the specific product, its data model, training, installation, and documented support. They should not be assumed from a generic real-time chart.
For Grus energy monitoring, use the verified boundary: whole-home visibility, selected circuit-level insight, and historical patterns. Do not interpret a spike, circuit name, or dashboard category as proof that the system automatically and accurately identified a particular appliance.
This boundary prevents two common mistakes:
- Treating an estimated category as a confirmed device measurement.
- Expecting a panel monitor to control appliances just because it can display their circuit’s energy pattern.
Visibility supports better questions. It is not the same as automatic identification, diagnosis, or control.

How WattPanel-2X fits this approach
The WattPanel-2X split-phase home energy monitor is designed for whole-home and selected circuit-level electricity visibility. The product supports two main CT inputs and optional monitoring for up to 16 individual circuits, depending on the selected CT scope and confirmed panel fit.
Use the product page to review service type, CT scope, connectivity, current availability, and installation boundaries before ordering. Installation and service around an electrical panel must be handled by qualified electrical personnel. This article does not provide panel-opening, wiring, or CT installation instructions.
A repeatable workflow
When you want to understand a change without checking every appliance, use this sequence:
- Define the question. Choose a time period, a daily total, or a repeated pattern—not a vague goal to “find waste.”
- Check the whole-home view. Confirm whether the pattern is real and repeatable.
- Narrow to verified circuits. Compare only correctly mapped circuit data over the same period.
- Add utility context. Use the utility’s own interval and billing information when cost or billed energy is the question.
- Measure one device only when appropriate. Use a compatible plug-level tool or qualified professional support for a specific follow-up.
- Keep conclusions proportional to the evidence. A pattern suggests where to look next; it does not automatically identify a device or diagnose a fault.
This layered approach gives you useful energy visibility without turning every appliance into a separate monitoring project—and without promising more certainty than the data can provide.