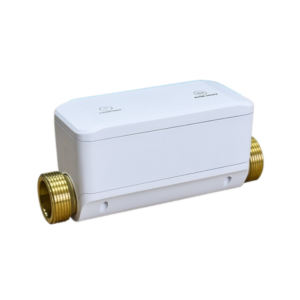
With the increasing integration ofsolar panels, battery storage, EV charging stations, and home appliances, homeowners often struggle to get aclear picture of their energy flow. Understandingwhere energy is being generated, stored, and consumedis crucial for optimizing efficiency and reducing electricity costs.
Aมิเตอร์วัดพลังงานอัจฉริยะจัดเตรียมให้real-time monitoringof:
✅Grid electricity usage– Track power drawn from the grid.
✅Solar generation– Monitor how much solar power is being produced.
✅Battery storage status– See energy stored and discharged from batteries.
✅EV charging consumption– Understand how much energy your electric vehicle is using.
✅Home appliance power usage– Identify energy-hungry devices.
In this guide, we’ll explain:
🔹How to install smart meters across your home energy system
🔹How to structure energy monitoring for full visibility
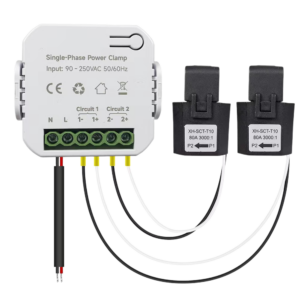
🔹How AI-powered smart meters likeGrus จอภาพไฟฟ้าแบบแยกเฟสcan optimize energy use
1. Understanding the Energy Flow in a Smart Home
Before installing aมิเตอร์วัดพลังงานอัจฉริยะ, it’s essential to understand theenergy flow in a modern homethat integrates:
1️⃣The Power Grid– Provides electricity when solar power is insufficient.
2️⃣แผงโซล่าเซลล์– Generate renewable energy during the day.
3️⃣Battery Storage– Stores excess solar power for nighttime use.
4️⃣สถานีชาร์จรถยนต์ไฟฟ้า– Consumes significant energy for vehicle charging.
5️⃣Home Appliances– Various devices that require energy for daily operations.
1.1 Energy Flow Diagram for a Smart Home with Solar & Battery Storage
graph TD;

    %% Top Section - Power Sources
    A[Power Grid] -->|CT1: Measures Import/Export Power| B[Main Panel]
    F[Solar Inverter] -->|CT2: Measures Solar Output| B
    F -->|CT6: Charges Battery| E[Battery Storage]
    E -->|CT3: Discharges Power| B

    %% Center - Main Panel as Distribution Hub
    B -->|CT5: Tracks Total Home Power| C[Home Appliances]
    B -->|CT4: EV Charging Load| D[EV Charger]

    %% Labels for Phase Type
    B -.->|Split-Phase 240V (L1, L2, Neutral)| H[Split-Phase System]
    B -.->|Single-Phase 120V (L1, Neutral)| I[Single-Phase System]
CT Clamp Placement & Line Descriptions
| CT Clamp | Installation Line | จอภาพ | วัตถุประสงค์ |
|---|---|---|---|
| CT1 | Between Grid and Main Panel | Grid Power Import/Export | Tracks how much electricity is drawn from or sent back to the grid |
| CT2 | Between Solar Inverter and Main Panel | Solar Power Output | Measures real-time solar generation |
| CT3 | Between Battery and Main Panel | Battery Discharge | Tracks how much stored energy is being used |
| CT4 | Between EV Charger and Main Panel | EV Charging Load | Identifies energy used by the electric vehicle |
| CT5 | Between Main Panel and Home Loads | Total Home Consumption | Tracks overall household power usage |
| CT6 | Between Solar Inverter and Battery Storage | Battery Charging | Measures how much solar energy is stored in the battery |
🔹ข้อมูลเชิงลึกที่สำคัญ:Aมิเตอร์วัดพลังงานอัจฉริยะ(G) should be positioned tomonitor all major energy sourcesand their flowto and from the home.
2. Where to Install Smart Energy Meters for Full Energy Visibility
To get a complete view of energy consumption and generation, smart meters should be installed instrategic locations:
2.1 Recommended Smart Meter Installation Points
| ที่ตั้ง | วัตถุประสงค์ | What It Monitors | Recommended Meter |
|---|---|---|---|
| การเชื่อมต่อกริด (แผงหลัก) | Track electricity imported/exported to the grid | Grid power usage & net metering | จอภาพไฟฟ้าแบบแยกเฟส |
| เอาท์พุตอินเวอร์เตอร์พลังงานแสงอาทิตย์ | Measure solar energy production | Real-time solar generation | มิเตอร์อัจฉริยะแบบหนีบ |
| อินพุต/เอาต์พุตของแบตเตอรี่สำรอง | Monitor charge/discharge cycles | Battery state of charge & usage | Bidirectional Power Meter |
| สถานีชาร์จรถยนต์ไฟฟ้า | Track EV charging consumption | Charging energy and cost per session | Dedicated EV Energy Monitor |
| แผงเครื่องใช้ในบ้าน | Identify energy-hungry devices | Individual appliance usage | Smart Plug Meters or Subpanel Monitor |
💡Best Solution:TheGrus จอภาพไฟฟ้าแบบแยกเฟสcan monitorgrid power, solar, battery, and home consumptionในเวลาจริง
3. Step-by-Step Smart Energy Meter Installation Guide
3.1 Installing a Smart Meter at the Grid Connection (Main Panel)
📌Purpose:Measure total powerimported from and exported to the grid.
ขั้นตอนการติดตั้ง:
1️⃣Turn off the main circuit breaker for safety.
2️⃣Open the electrical panel and identify the main power lines.
3️⃣Attach clamp sensors around the incoming grid power cables.
4️⃣Connect sensors to the smart energy monitor.
5️⃣Secure the device and restore power.
6️⃣Pair with a smart home app for real-time tracking.
3.2 Installing a Smart Meter for Solar Panel Output
📌Purpose:Tracksolar generation in real-timeto optimize usage.
ขั้นตอนการติดตั้ง:
1️⃣Locate the output wires from the solar inverter.
2️⃣Attach a smart meter to measure DC or AC power output.
3️⃣Integrate the meter with home energy monitoring software.
4️⃣Analyze data to track solar efficiency and adjust power consumption.
3.3 Installing a Smart Meter for Battery Storage
📌Purpose:เฝ้าสังเกตenergy stored and discharged from home batteries.
ขั้นตอนการติดตั้ง:
1️⃣Connect a bidirectional smart meter to the battery system.
2️⃣Attach clamp sensors to both charge and discharge lines.
3️⃣Monitor battery efficiency via the smart meter dashboard.
3.4 Installing a Smart Meter for EV Charging
📌Purpose:TrackEV charging power consumptionto optimize electricity usage.
ขั้นตอนการติดตั้ง:
1️⃣Install a smart energy monitor on the EV charging circuit.
2️⃣Configure time-based charging to avoid peak electricity rates.
3️⃣Use the smart meter’s dashboard to track per-session energy costs.
graph TD
    A[Smart Energy Meters] -->|Monitor Usage| B[Grid]
    A -->|Monitor Solar Output| C[Solar Inverter]
    A -->|Monitor Battery Charge/Discharge| D[Battery Storage]
    A -->|Monitor EV Charging| E[EV Charger]
    A -->|Monitor Home Appliances| F[Smart Home Dashboard]
🔹ข้อมูลเชิงลึกที่สำคัญ:Installing multiple smart meters ensuresreal-time insights across all major energy sources.
Next Steps
Now that we understandwhere and how to install smart energy meters, inPart 2, we’ll discuss:
📌How to analyze smart meter data for energy optimization
📌Using AI-powered insights for efficiency improvements
📌 **WhyGrus จอภาพไฟฟ้าแบบแยกเฟสis a top choice for smart home energy tracking
4. How to Analyze Smart Meter Data for Energy Optimization
Once yoursmart energy metersare installed across the grid, solar panels, battery storage, EV charging station, and household appliances, the next step isunderstanding and utilizing the data effectively.
By analyzing smart meter data, you can:
✅Track power generation vs. consumption– See if solar meets your needs.
✅Optimize battery usage– Ensure stored power is used efficiently.
✅Reduce peak demand costs– Shift heavy loads to off-peak hours.
✅Prevent unnecessary energy waste– Identify standby power drain.
4.1 Understanding Smart Meter Data from Different Sources
Each energy source and load contributes unique data points. Below is an overview of what to monitor:
| แหล่งพลังงาน | Key Metrics to Track | Optimization Strategy |
|---|---|---|
| Grid Power | kWh consumed, time-of-use costs | Shift loads to off-peak hours |
| แผงโซล่าเซลล์ | kWh generated, real-time production | Maximize self-consumption, store excess power |
| Battery Storage | Charge/discharge cycles, SOC % | Store excess solar, discharge during peak rates |
| การชาร์จรถยนต์ไฟฟ้า | kWh per session, charging cost | Schedule charging during cheap electricity hours |
| Home Appliances | Individual power usage (W) | Identify & reduce high-energy devices |
💡ตัวอย่าง:If your battery storage data showslow charge levels at night, you may need to adjust thecharging scheduleto store excess solar power during the day.
4.2 Visualizing Energy Data for Better Decision-Making
Asmart energy monitoring dashboardconsolidates data frommultiple metersto provide aclear picture of home energy flow.
graph TD;
A[Smart Meters] -->|Collect Data| B[Energy Monitoring System]
B -->|Generates Reports| C[Real-Time Dashboard]
C -->|Suggests Energy Optimization| D[User Adjustments]
🔹ข้อมูลเชิงลึกที่สำคัญ:A well-structured dashboard helps homeownersanalyze trends, identify inefficiencies, and automate power optimization.
5. AI-Powered Insights for Smart Energy Efficiency
Modern smart meters useAI-driven analyticsto automatically optimize energy consumption.
5.1 AI-Based Predictive Energy Management
โดยใช้อัลกอริทึมการเรียนรู้ของเครื่องAI สามารถ:
✅Forecast solar generation & optimize battery storage
✅Detect unusual power usage (e.g., faulty appliances)
✅Automatically adjust smart home devices based on energy demand
sequenceDiagram
    participant Smart Meter
    participant AI Energy System
    participant Smart Home Devices
    participant User

    Smart Meter ->> AI Energy System: Sends real-time energy data
    AI Energy System ->> Smart Home Devices: Optimizes power distribution
    AI Energy System ->> User: Sends energy-saving recommendations
    User ->> AI Energy System: Adjusts energy preferences
💡ตัวอย่าง:If AI detectshigh grid power usage during peak hours, it canautomatically switch to battery storageto reduce costs.
5.2 Automating Energy Efficiency with Smart Home Integration
By integratingมิเตอร์อัจฉริยะกับhome automation platforms, homeowners can create energy-efficient routines:
| Automation Rule | Action | Result |
|---|---|---|
| If solar power > home demand | Charge battery | Store excess solar energy |
| If battery < 20% | Draw from grid during off-peak hours | Minimize expensive peak-hour power use |
| If EV charging costs are high | Delay charging to off-peak hours | Reduce electricity bill |
| If appliance power draw is high | Send alert or auto-turn off | Prevent energy waste |
🔹ข้อมูลเชิงลึกที่สำคัญ:ระบบอัตโนมัติที่ขับเคลื่อนด้วย AIreduces energy costs while maintaining comfort.
6. Why Grus Split-Phase Electric Monitor is the Best Smart Energy Solution
Forcomplete energy monitoringacrossgrid power, solar, battery storage, EV charging, and home appliances, เดอะGrus จอภาพไฟฟ้าแบบแยกเฟสprovides:
✔การติดตามพลังงานแบบเรียลไทม์– Instant data on power usage & generation.
✔การตรวจสอบระดับเครื่องใช้ไฟฟ้า– Identify and optimize high-energy devices.
✔AI-Based Energy Recommendations– Reduce waste & cut electricity bills.
✔ติดตั้งง่าย– Non-invasive, clamp-on design.
✔การบูรณาการกับ SmartThings และ Home Assistant– เพิ่มประสิทธิภาพการใช้พลังงานโดยอัตโนมัติ
graph TD;
A[Grus Smart Meter] -->|Monitors Grid & Solar| B[Real-Time Energy Dashboard]
A -->|Optimizes Battery Storage| C[Smart Home System]
A -->|Tracks Appliance Power Usage| D[User Reports & Alerts]
🚀เหตุใดจึงควรเลือก Grus?
- Saves up to 25% on electricity bills
- Provides deeper energy insights than utility meters
- Seamlessly integrates with existing smart home setups
👉Get the Grus Split-Phase Electric Monitorand take control of your home energy today!
A Smarter Way to Manage Home Energy
ด้วยproperly installed smart energy meter system, homeowners cantrack, analyze, and optimizetheir entire energy ecosystem.
ประเด็นสำคัญ:
✅Strategically install smart metersfor grid, solar, storage, EV charging, and home loads.
✅Use real-time monitoringto understand energy usage patterns.
✅Leverage AI-based automationfor cost savings & efficiency.
✅TheGrus จอภาพไฟฟ้าแบบแยกเฟสis an all-in-one solution for comprehensive energy management.🚀 Future-proof your home’s energy system today!
